You may be bombarded with messages to “make your IRA contribution” this time of year.
For 2017, you have until April 18th tax day to finalize that contribution for the 2016 calendar year.
I was curious as to whether we could calculate various contribution amounts over many different time periods to see how long it would take to accumulate $1 million in an IRA.
So I fired up an Excel spreadsheet mainly because I wanted to create a matrix that shows many results in a small window.
Normally I would have fired up my RetirementView software and just run some numbers in there. But if I did that I would have to run each scenario and then log the results.
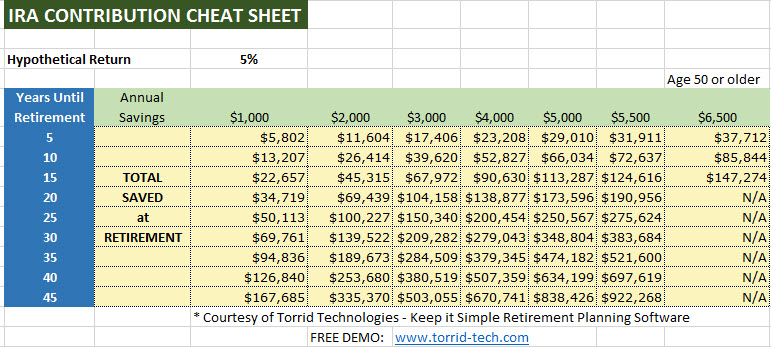
Here is the “cheat sheet” that I created in Excel for 2017.
To explain what this means, I first explain that the entire calculation is based on a flat 5% return. If you had my spreadsheet, you could change this return and have the matrix recalculate all the values at a different return.
The left column in blue shows the number of years until retirement – this is the number of years that you “save” the amount specified in “Annual Savings”.
The green “Annual Savings” columns are showing you the calculations if you save $1,000 each year or $2,000 each year…. for the time period in blue.
The yellow area shows you the total amount accumulated for the time period including the compound interest of 5%.
Did I get to $1 million?
No. The only place we got close was if we saved $5,500 a year for 45 years.
My guess is if we increased the interest rate to 6% we would be over the top.
So I did that in my Excel spreadsheet and voila the $5,500 for 45 years gets us to $1,240,295!
If you’d like to get a copy of my little IRA Contribution cheat sheet spreadsheet in EXCEL format, then CLICK HERE to get your copy of the Cheat Sheet for FREE.
Thanks and Happy Planning!


Speak Your Mind
You must be logged in to post a comment.